
Figure 3.
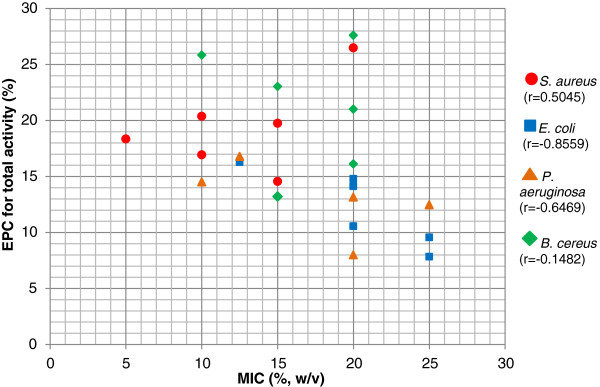
Scatter plot employed to find association between MIC and EPC of Malaysian honey against four bacteria tested.S. aureus (circle), E. coli (square), P. aeruginosa (triangle) and B. cereus (diamond). Pearson’s correlation coefficient, r (parentheses) was calculated to demonstrate intraspecific bacterial association between MIC and EPC. There was no correlation between MIC and EPC of entire bacteria population obtained (r = -0.2848).