
Figure 1. Distribution of i3Drefine refinement for all submitted structures.
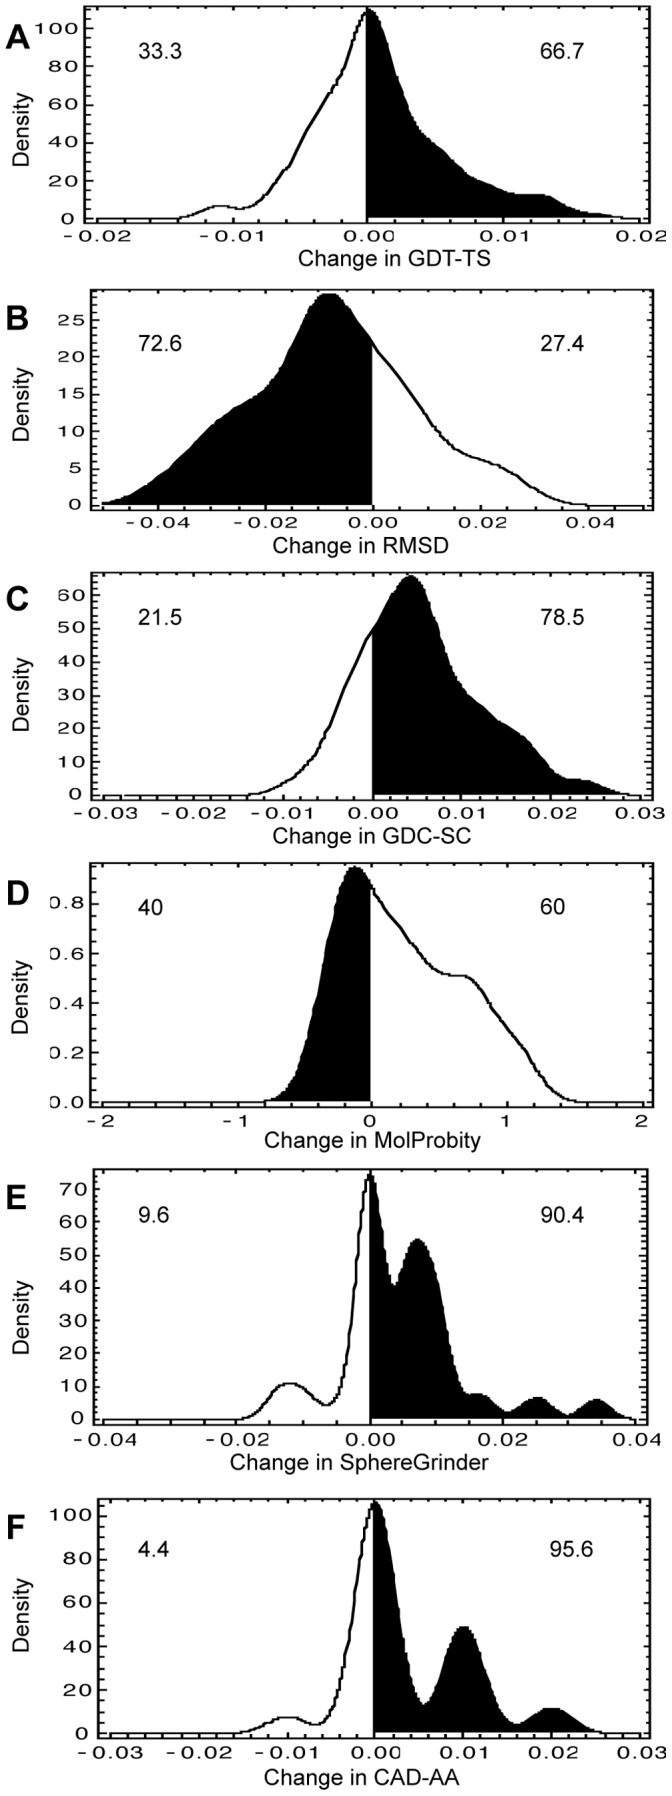
Distributions of change in quality scores after i3Drefine refinement are shown for these metrics: (A) GDT-TS, (B) RMSD, (C) GDC-SC, (D) MolProbity, (E) SphereGrinder and (F) CAD-AA. Regions shaded in black indicate improvement over the starting model. The numeric values are the percentage of times the structures were made better or worse for each metric.