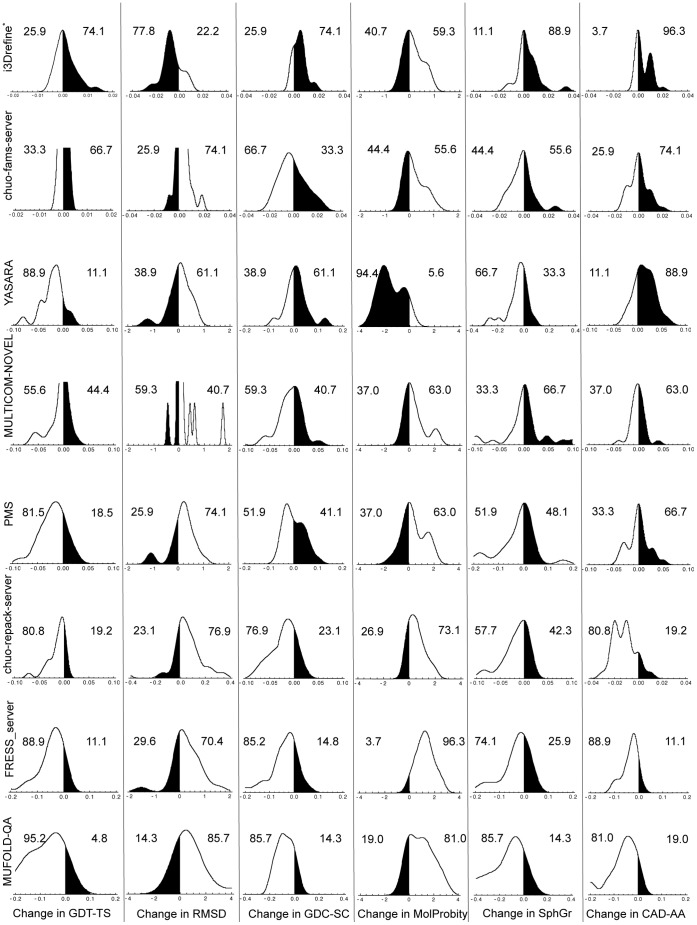
Figure 4. Distribution and degree of refinement for top server groups based on first submitted model.
Distribution and degree of score changes relative to starting models for the 8 groups based on the first submitted models. The X-axis shows changes in scores with respect to the starting model. Regions shaded in black indicate improvement over the starting model. The numeric values are the percentage of times the structures were made better or worse than the starting model for each metric. The groups are ordered by the sum of overall quality score. * CASP10 group name for i3Drefine is MULTICOM-CONSTRUCT.

