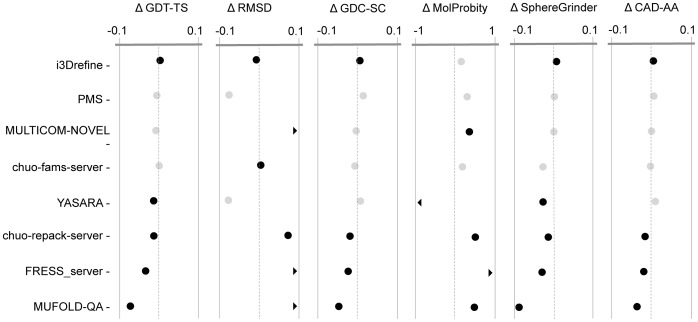
Figure 7. Summary of the average score changes and their statistical significance for top server groups based on best submitted model.
Average score changes and their statistical significance relative to starting models for the 8 groups based on the best submitted models as judged by quality score for each target. Each column shows one of the metrics we used to evaluate performance. The scales are marked at ± Average Changes relative to the ‘Void’ group. For GDT-TS, GDC-SC, SphereGrinder and CAD-AA scores, positive changes indicate the quality of the model has been improved by refinement whereas for RMSD and MolProbity, negative changes represent improvement. Black points are statistically distinguishable from the Null group; gray points are indistinguishable (Wilcoxon signed-rank test, P = 0.05). A chevron indicates that the corresponding score is off the scale.

