
Figure 1.
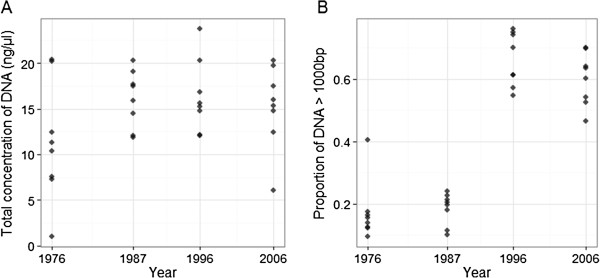
Temporal variation of DNA quality in archived scale samples. We show relationships between A. Total DNA concentration and Year, and B. Proportion of high molecular weight DNA (> 1000 bp) and year. Each point indicates an individual DNA extraction. Samples had been normalised to 50 ng/μl based on NanoDrop Spectrophotometer before total DNA concentration and fragment sizes were measured using an Agilent 2100 Bioanalyzer.