
Figure 3.
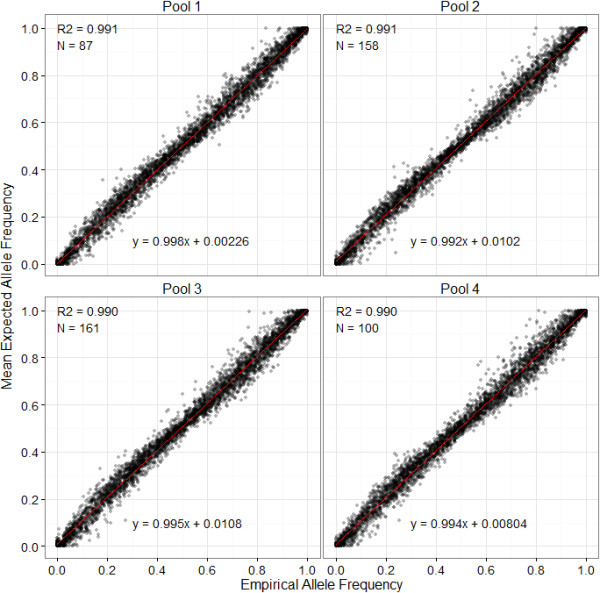
Correlation between mean estimated allele frequencies and empirical allele frequencies within each pool. Means were calculated from nine replicates within each pool. R2 is the adjusted R2 values from a linear regression. N is the number of individuals included in each pool.