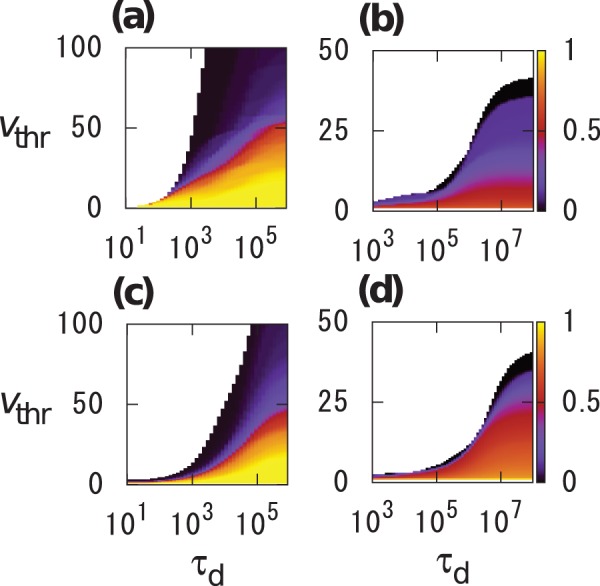
Figure 2. Dependence of the final infection size  on
on  and
and  .
.

(a), (b) Original temporal networks. (c), (d) Randomized temporal networks. (a), (c)  in Conference data set. (b), (d)
  in Email data set. No infection occurs in the blank parameter regions. The parameter values for which at least one infection occurs are colored.
