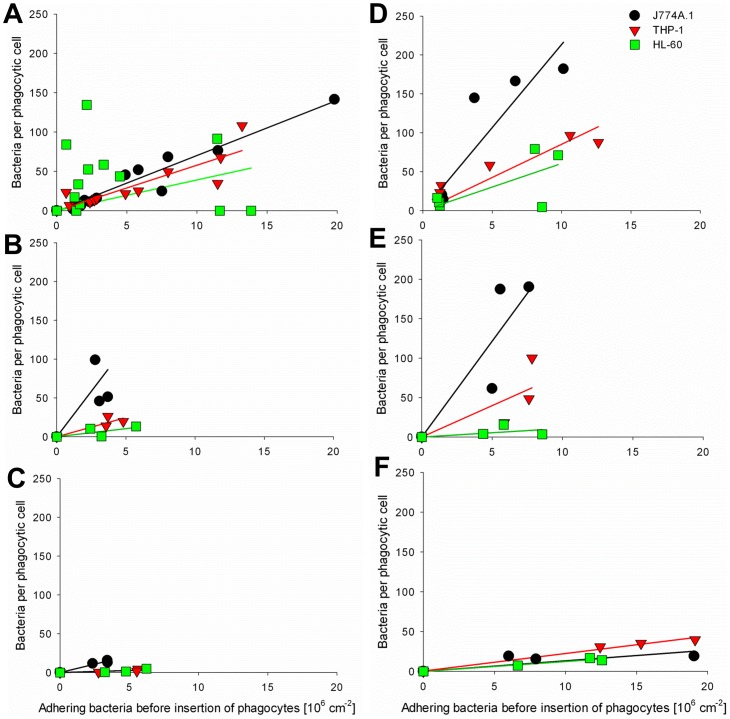
Figure 3. Staphylococci per phagocyte after 2 h versus the number of adhering bacteria initially present.
(A) S. epidermidis 3399 after 1 h, 3.5 h, 14 h and 24 h of bacterial growth, (B) S. epidermidis 7391 after 3.5 h bacterial growth, (C) S. epidermidis 1457 after 3.5 h bacterial growth, (D) S. aureus ATCC 12600GFP after 1 h and 3.5 h of bacterial growth, and (E) S. aureus 7323 after 3.5 h bacterial growth, (F) S. aureus LAC after 3.5 h bacterial growth. Solid lines indicate the best-fit to a linear function passing through origin.

