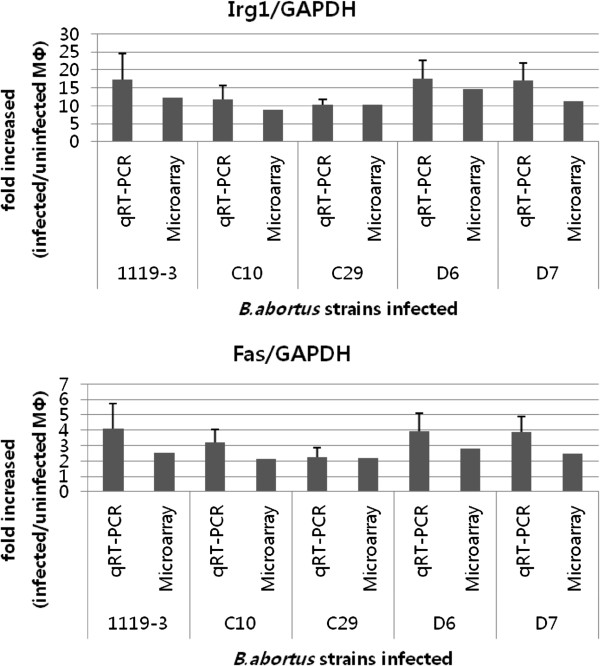
Figure 5.
Validation of microarray data by quantitative RT-PCR. The relative expression level was normalized by Gapdh expression level and relative to uninfected cells. RT-PCR data were averaged from three independent RNA isolation and presented as mean relative expression with an error bar which represents SEM.

