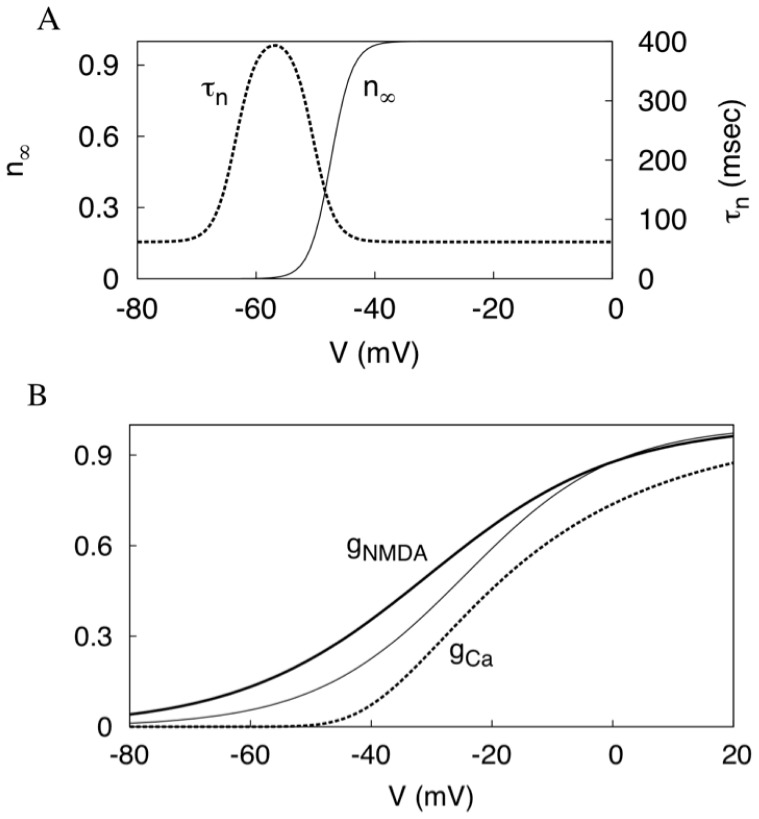
Figure 1. Model calibration.
(A) The activation curve and the time constant of the ERG current. (B) The comparison of the activation curves for the NMDAR conductance in the present (solid bold) and the previous (solid thin) models, and the calcium current (dashed). All conductances are normalized to the maximum value of 1.

