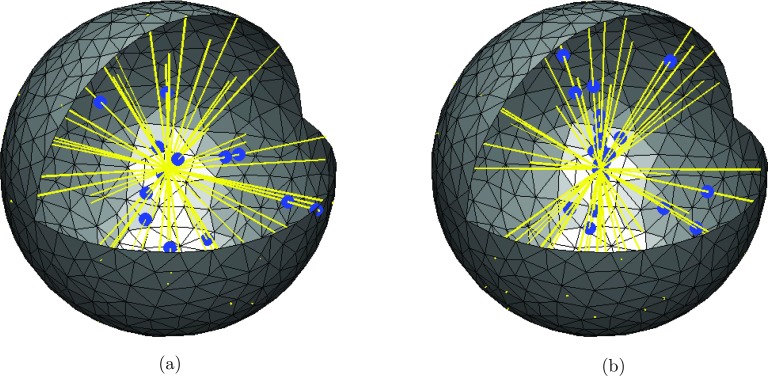
Figure 8.
Lines are yellow and the blue dots are molecules bound to the lines. Molecules in free space are not plotted. Molecules on the lines move by active transport towards the center of the sphere and the lines move in space according to Eq. 13. (a) t = 0.05 s. (b) t = 1.0 s.

