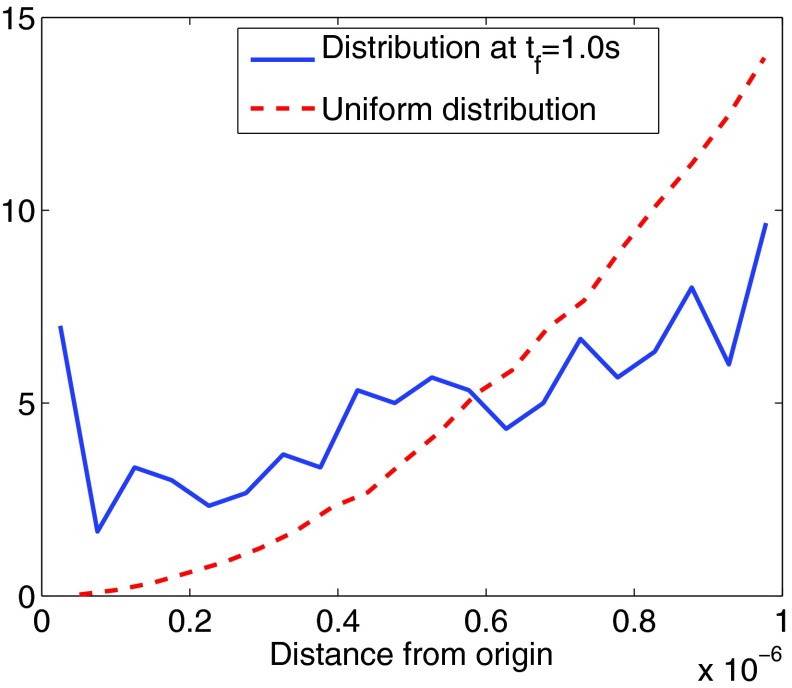
Figure 9.
The radial distribution of the positions of the molecules. The molecules have a uniform initial distribution in the sphere (dashed line). The distribution at the final time tf = 1.0 s is shifted towards the center of the sphere. The distribution at the final time, plotted in the figure above, is based on the mean of three trajectories.

