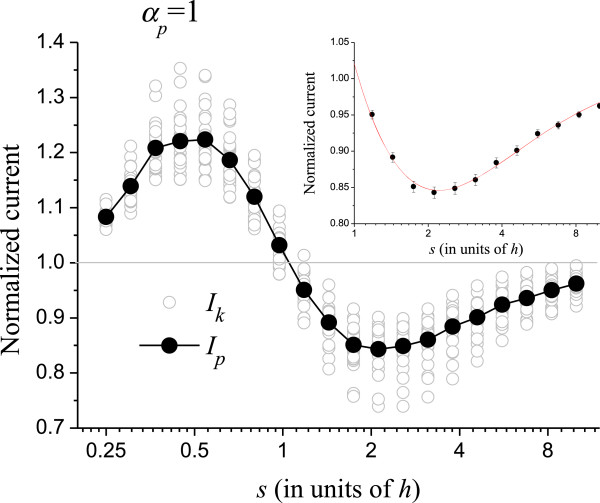
Figure 3.
Randomization in the (x,y) coordinates of the CNTs in the array. The gray opened circles are the normalized current Ik from an individual simulation run. The full circles are the average over 25 runs (Ip). The inset shows s > h superposed to an interpolating function that provides a numerical value for Ip.

