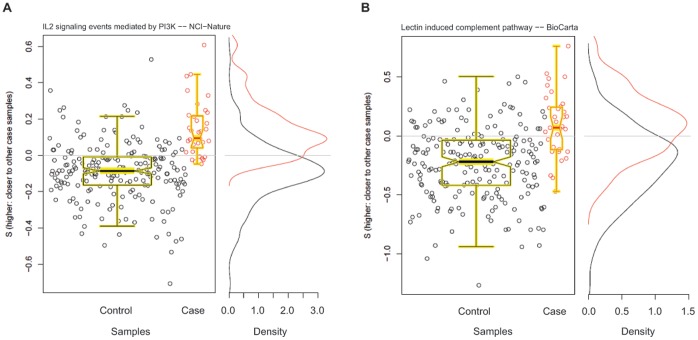
Figure 2. Two representative significant pathways in cirrhosis.
Scatter plots of distance score S for each pathway and overlayed with boxplots are given in the left panel; higher values of S indicate the sample is close to other cases than it is to other controls. Distribution of S for cases (red) and controls (black) are given to the right. A. “IL2 signaling events mediated by PI3K” – NCI-Nature. B. “Lectin induced complement pathway” – BioCarta.

