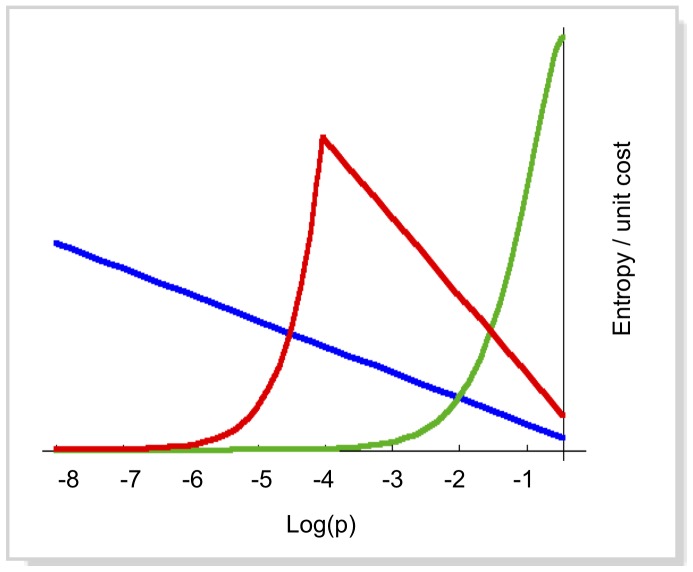
Figure 1. Entropy yield per unit cost, plotted as a function of the pattern probability (eq. 1).
Blue curve: limited bandwidth and unlimited pattern storage capacity (W = 0.001, N = ∞); green curve: limited storage and unlimited bandwidth (N = 100, W = ∞); Red curve: limited bandwidth and storage (N = 100, W = 0.001)). Parameter values and the vertical scale are arbitrarily chosen for illustration.

