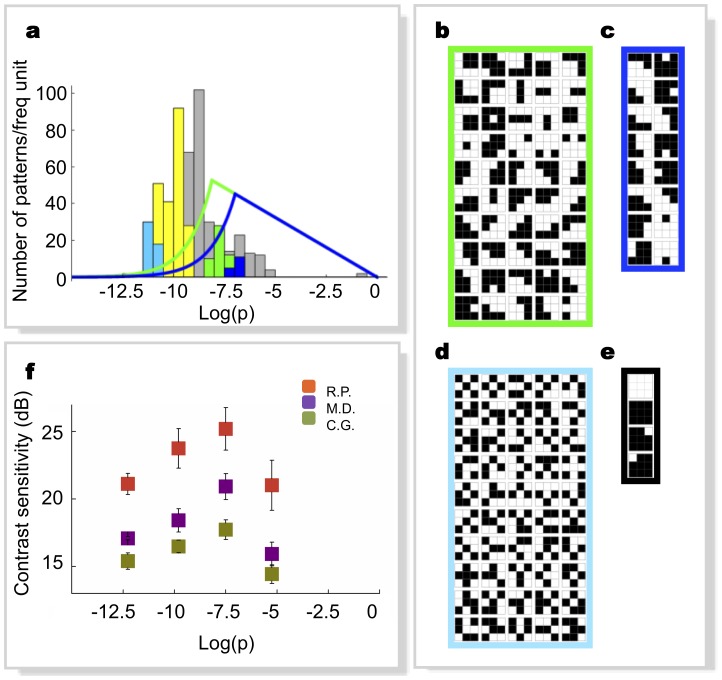
Figure 3. Human contrast sensitivity to visual patterns vs. model predictions.
a, Probability distribution of the 512 possible 3×3 1-bit pixel patterns (grey histogram). The curves are the model selection functions (eq. 1) for W = 0.05 and two different values of N.(green: N = 50; blue: N = 15). Green and blue histograms are the probability distributions of corresponding selected patterns. Their actual bandwidth occupancies ( ∫f(p)>c
pδ(p)dp) turn out to be slightly lower (respectively 0.025 and 0.015) than the imposed limit W. Cyan and yellow histograms are the distributions of low-probability patterns used in our measurements. b,c, Visualization of the pattern sets shown in (a), in green and blue respectively. d, Visualization of the lowest-probability patterns (discarded by our approach due to large storage occupation). e, Visualization of the highest-probability patterns (discarded due to large bandwidth occupation). f, Averaged sensitivity for detection of the patterns as a function of their probability, measured on three human subjects (different colors). Errors are determined by the fit (see Methods). The results of pairwise statistical comparisons (z tests, N = 100) amongst sensitivities plotted in (f) are:


