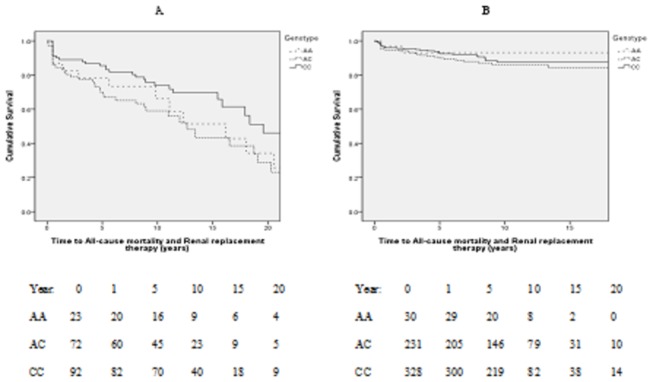
Figure 1. Kaplan-Meier analysis of time to all-cause mortality and renal replacement therapy in the Birmingham (A) and Northern European (B) cohort by genotype of CAV1 SNP rs4730751.

The number of patients at risk at separate time points is shown by year of follow-up. Graphic data shown to the last surviving 10% patients. p=0.022 (A) and p=0.427 (B).
