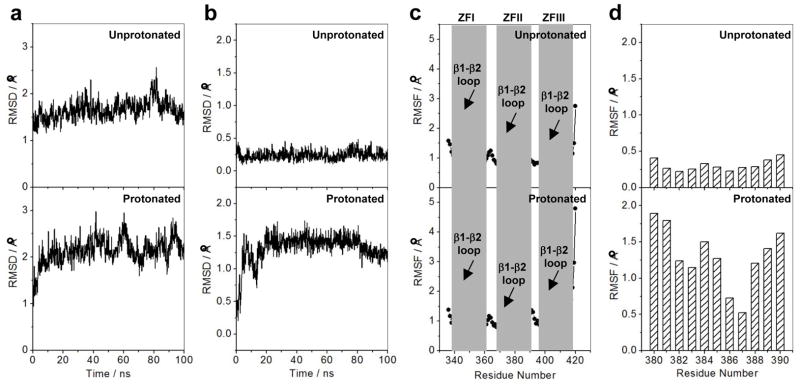
Figure 7.

Effect of protonation on the dynamics of DB domain of EGR1 as determined from MD analysis on the structural models of the DB_WT domain of EGR1 containing H382 in unprotonated and protonated forms in complex with the ZRE duplex. Note that in the unprotonated form, H382 is protonated only at Nε2 atom within the imidazole ring, while it is protonated at both Nε2 and Nδ1 atoms in the protonated form. (a) RMSD of backbone atoms (N, Cα and C) within each simulated structure relative to the initial modeled structure of DB domain as a function of simulation time in unprotonated (top panel) and protonated (bottom panel) forms. (b) RMSD per residue within each simulated structure relative to the initial modeled structure for the αII helix (residues 380–390) located within the ZFII of DB domain as a function of simulation time in unprotonated (top panel) and protonated (bottom panel) forms. (c) RMSF of backbone atoms (N, Cα and C) averaged over the entire course of corresponding MD trajectory of DB domain as a function of residue number in unprotonated (top panel) and protonated (bottom panel) forms. Note that the vertical gray boxes denote the boundaries of residues encompassing ZFI, ZFII and ZFIII within the DB domain. The position of β1-β2 loop within each zinc finger is also indicated. (d) RMSF per residue averaged over the entire course of corresponding MD trajectory for the αII helix (residues 380–390) located within the ZFII of DB domain as a function of residue number in unprotonated (top panel) and protonated (bottom panel) forms.
