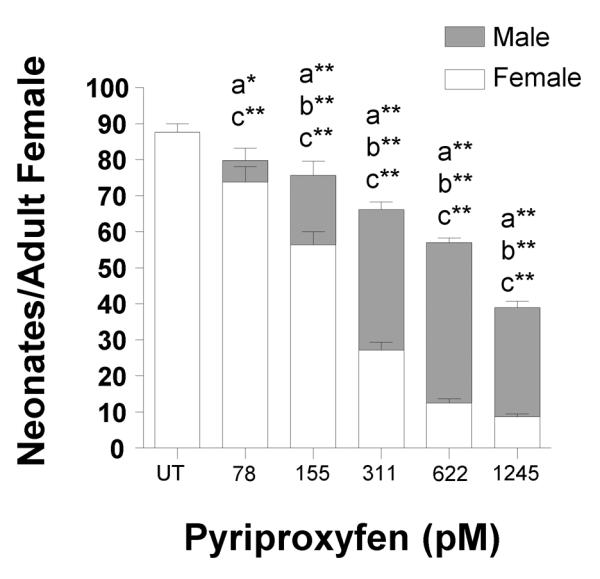
Fig. 1. Influence of pyriproxyfen on overall fecundity and male production.

The number of male and female neonates produced per adult female. Data are shown as mean ± SEM. (a) Indicates a significant difference in the total number of neonates produced, (b) indicates a significant difference in the number of male neonates produced, and (c) in dicates a significant difference in the total number of female neonates produced compared to the untreated (UT) control. Statistical differences were analyzed by ANOVA followed by Dunnett's multiple comparison test and an (*) indicates p < 0.05 and (**) indicates p < 0.01 (n = 10).
