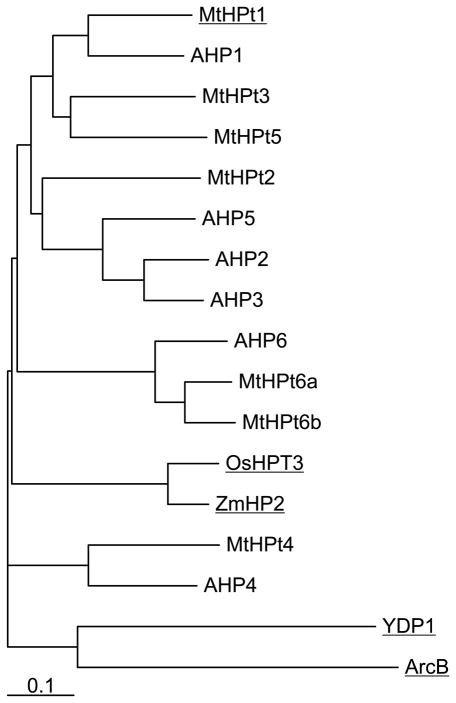
Fig. 4.
A phylogram of amino acid sequences of HPt proteins [UniProt accession numbers in brackets]. Source organisms: E. coli (ArcB) [C6EH17]; A. thaliana (AHP1-6) [Q9ZNV9, Q9ZNV8, Q9SAZ5, Q9LU15, Q8L9T7, Q9SSC9]; M. truncatula (MtHPt1-6b) [B7FGU6, G7I2T8, A2Q3H8, G7IHZ7, G7I7G5, G7JGY0, G7II71]; O. sativa (OsHPT3) [Q6VAK4]; Z. mays (ZmHPT2) [Q9SLX1] and S. cerevisiae (YPD1) [Q07688]. Proteins with determined crystal structures are underlined. The scale bar at the bottom indicates the number of amino acid substitution per site.

