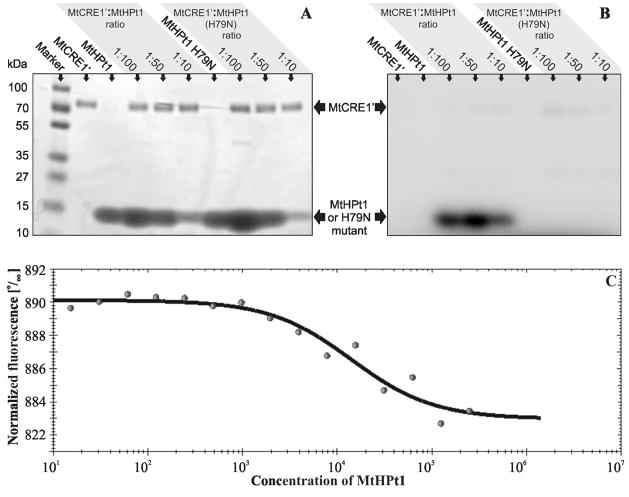
Fig. 7.
Biochemical properties of MtHPt1. A, B Autoradiography of enzymatic phosphorylation of MtHPt1 by MtCRE1′ with γ32P- labeled ATP as a phosphate donor. The H79N mutant of MtHPt1 was utilized as a negative control. Different ratios of the interacting proteins were used as indicated above the gels. The same gel was analyzed using autoradiography (B) and stained with Coomassie Brilliant Blue R-250 (A). C Results of Micro-Scale Thermophoresis. The experimental points and the fitted curve are shown. Concentration of MtHPt1 is plotted in nM. Fifteen measurements were taken at different MtCRE1′:MtHPt1 ratios. The change in fluorescence is the result of complex formation. The migration rate of the labeled protein (MtCRE1′) in a thermal gradient is slower upon binding to MtHPt1.

