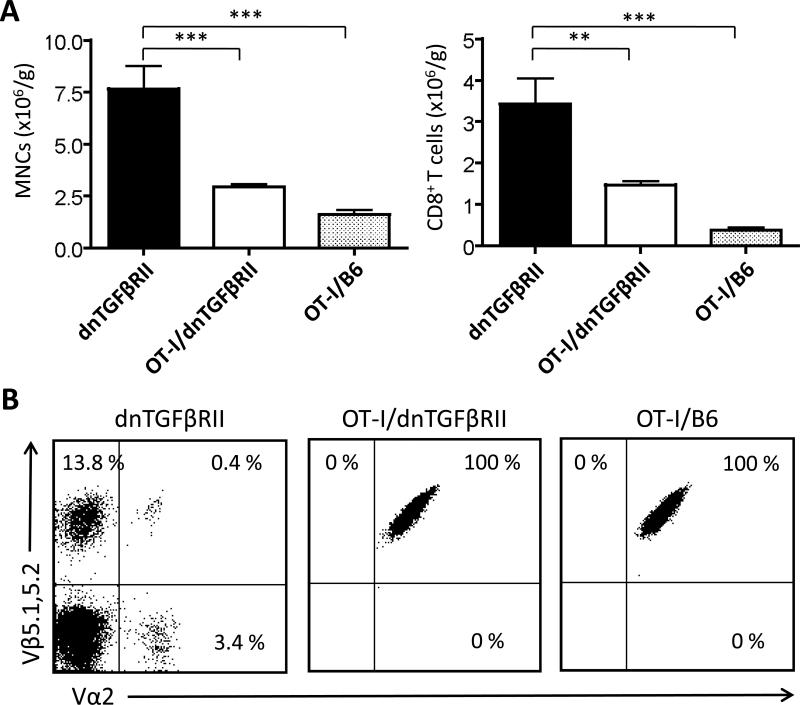
Figure 6.
Flow cytometric analysis of the total MNCs and CD8+ T cells in liver of recipients transferred with CD8+ T cells from dnTGFβRII, OT-I/dnTGFβRII/Rag1-/- (OT-I/dnTGFβRII), and OT-I/Rag1-/- (OT-I/B6) donors at 8 weeks after transfer. (A) Number of total MNCs and CD8+ T cells in the liver. Each group included 8 mice. (B) Analysis of TCR Vα2 and Vβ5.1, 5.2 for hepatic CD8+ T cells. Data are expressed as the mean ± standard deviation. **p<0.01,***p<0.001 determined using one-way ANOVA followed by a Bonferroni multiple comparisons test or Kruskal-Wallis test followed by Dunn's multiple comparisons test.

