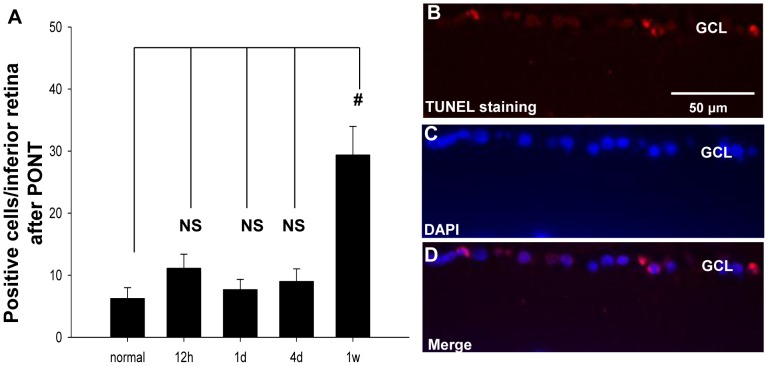
Figure 6. TUNEL staining in the inferior retinas after PONT.
(A) The number of positive-staining cells increased significantly in the inferior retinas 1 week after PONT, compared with the normal retinas (P<0.01). There were no significant differences between normal and any other group. (B) The positive cells in the GCL of the inferior retina 1 week after PONT (red). The positive staining was located in the nuclei (C, D), which is shown with DAPI (blue). (n = 4, 3, 3, 5 and 4 in normal, 12 h, 1d, 4d and 1w groups respectively.).

