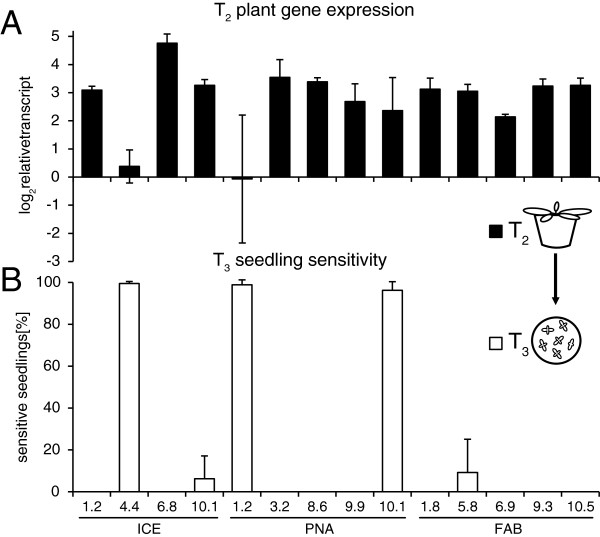
Figure 2.
Comparison of transgene expression and the subsequent loss of hygromycin resistance. A, Gene expression analysis in homozygous plants of 14 independent N. attenuata lines expressing three different antimicrobial peptides (PNA, ICE and FAB). Transcript abundance was determined by qRT-PCR on cDNA of rosette-stage leaves in T2 plants. Bars indicate the ΔCT mean expression (log2 fold expression) relative to actin as the reference gene (±SD, n = 3 plants). The independent transgenic lines showed different strengths of transgene expression, with occasionally low or variable pattern in certain lines. B, Hygromycin sensitivity of T3 seedlings (direct descendants of the plants used for gene expression). Per plant, 60 seeds were germinated on a hygromycin containing GB5 medium (±SD, n = 3 plants). Homozygous plants should be fully resistant and show 0% sensitivity. The X-axis indicates line number and genotype.

