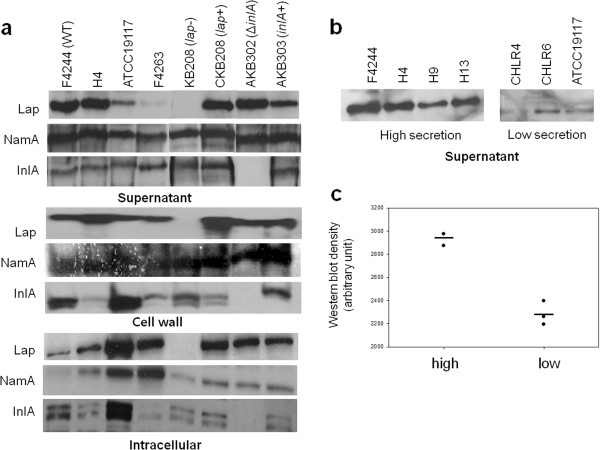
Figure 2.
Analysis of Lap distribution in cellular fractions. (a) Western blot analysis showing levels of Lap in different cell fractions (supernatant, cell wall and intracellular). Distribution of N-acetyl muramidase (NamA) and InternalinA (InlA) was also monitoted in the same cell fractions. (b) Lap secertion levels in supernatant of several other clinical isolates (H4, H9, H13, CHLR4, CHLR6) were monitored. (c) Densitometric analysis of intesity of Lap bands from panel 2b. L. monocytogenes F4244 (WT), lap mutant (lap-), lap complemented (lap+), ΔinlA and inlA complemented (inlA+) strains were used as controls.

