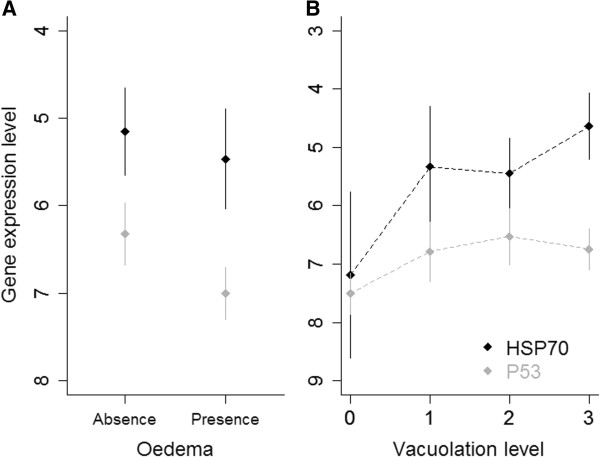
Figure 3.

Relation between gene expression levels and the presence of UV-induced microscopic damage. A) Relationship between mean expression levels of P53 and HSP70 genes (in ΔCt, y axis is inverted) and occurrence of intracellular oedema (absence: n = 20; 1; presence: n = 37). B) Variation in HSP70 and P53 expression levels (in ΔCt, y axis inverted) for each level of cytoplasmic vacuolation (level 0 corresponding to absence and level 3 to high abundance; n = 5, 14, 20, 18 for level 0, 1, 2, 3 respectively). Bars ± 95% CI.
