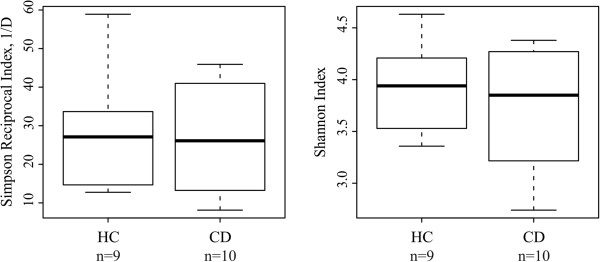
Figure 3.

Duodenal microbiota diversity in healthy control (HC, n = 9) and celiac disease (CD, n = 10) children. The dominant/common species richness and evenness was assessed by Simpson Reciprocal (1/D) and overall species richness and evenness was assessed by Shannon Indices. Boxplot shows 25th to 75th percentile, with a line at median.
