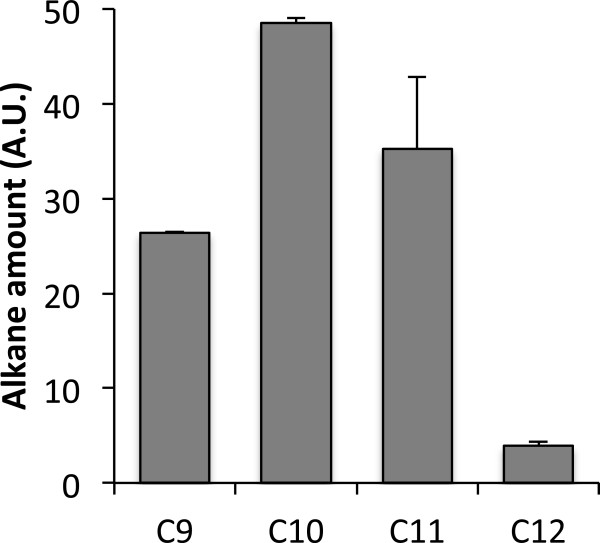
Figure 2.
GC analyses of intracellular alkanes in S. cerevisiae. Cells were exposed to 2% of each n-alkane for 48 h. Intracellular alkanes were measured by GC and normalized to the total protein amount and the internal standard n-tridecane. A.U., arbitrary unit. Error bars represent standard deviations from three biological replicates.

