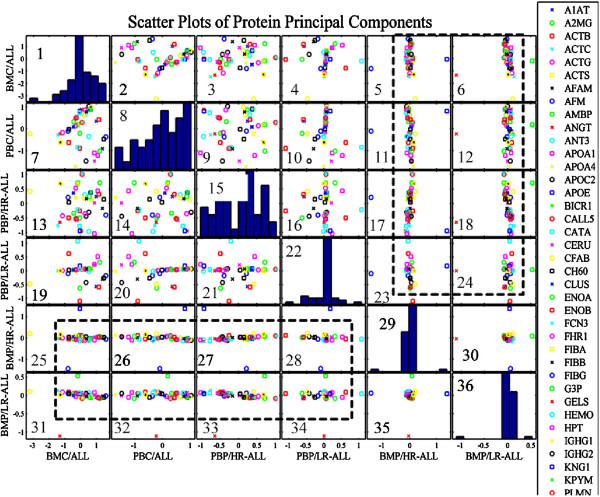
Figure 6.
Scatter plots of Principal Components of protein expression levels. Linear correlations were revealed between the principal components of BMP/LR and BMP/HR patients and BMC, PBC, PBP/HR and PBP/LR. In addition, between BMP/HR and BMP/LR six proteins appeared to distinguish between the stratified patients: AMBP, AFM, GELS, KNG1, CATA and S10A9 (BMP/HR: Bone Marrow Plasma/High Risk, BMC: Bone Marrow Cells, PBC: Peripheral Blood Cells, PBP/HR: Peripheral Blood Plasma/High Risk, PBP/LR: Peripheral Blood Plasma/Low Risk, BMP/LR: Bone Marrow Plasma/Low Risk, ALL: Acute Lymphoblastic Leukemia).

