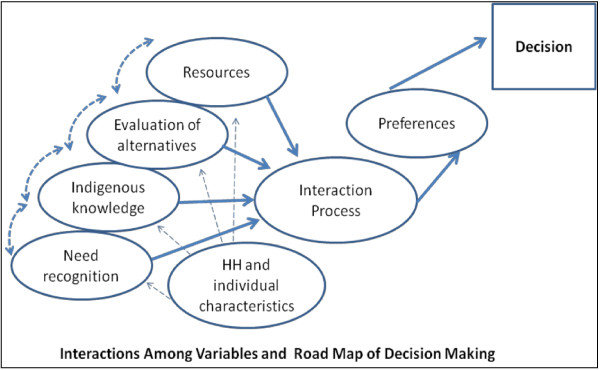
Figure 1.

The decision-making process of KA patients as indicated by participants in the qualitative surveys. Note: The ovals show the decision-making process at each level and the rectangle shows the final decision. The causal relationships are shown by solid arrows, two-way interactive relationships by dashed two-side arrows, and one-way interactive relationships by dashed one-side arrows.
