Figure 3.

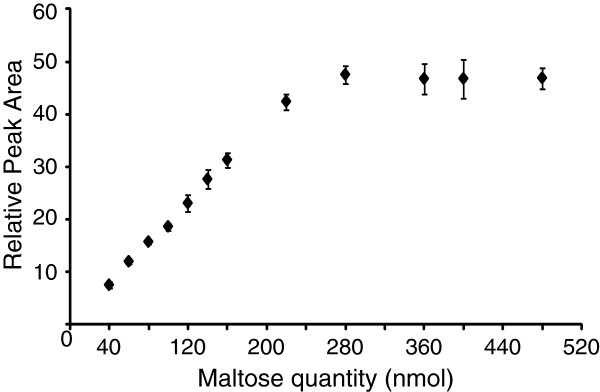
Peak area is proportional to oligosaccharide quantity. Maltose was derivatised with APTS and the resulting peak area compared to an internal standard. Bars represent s.d, n=3.

Peak area is proportional to oligosaccharide quantity. Maltose was derivatised with APTS and the resulting peak area compared to an internal standard. Bars represent s.d, n=3.