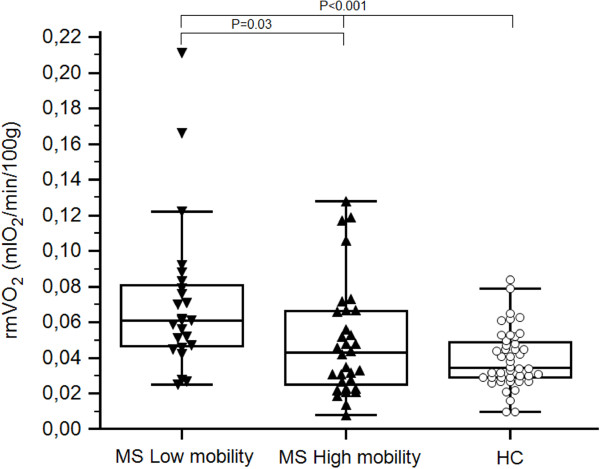
Figure 2.
Comparison between rmVO2 values of legs of MS population ranked according to mobility. Values of healthy controls were also included. Legend to figure: rmVO2, resting muscle oxygen consumption; MS, Multiple Sclerosis; HC, healthy controls. Statistical analysis: Unpaired Student T-test between MS low and high mobility; One-way ANOVA among MS low and high mobility, and HC.

