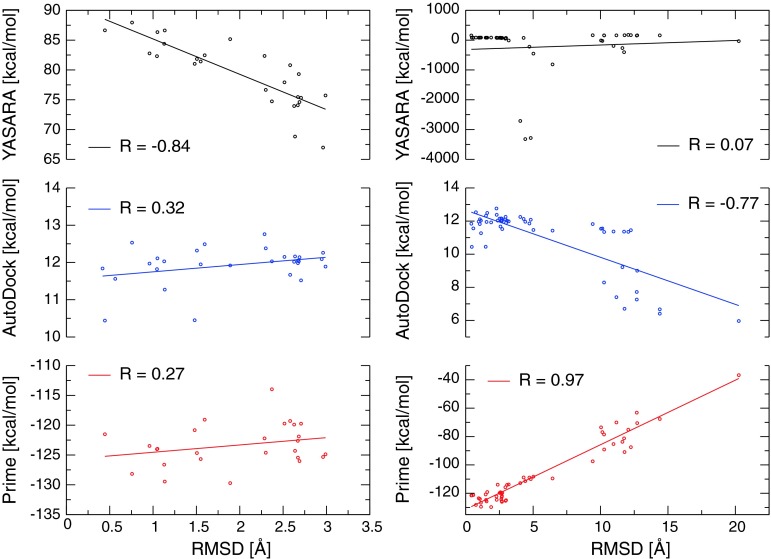
Fig. 3.
Correlation of calculated binding energies and RMSD of redocked QNB to 3UON. Calculated YASARA binding energies (top), AutoDock energies (middle) and Prime MMGB/SA energies (bottom) of poses from QNB re-docking to 3UON are plotted against their RMSDs. Detail with poses of RMSD of ligand smaller than 3 Å is on left and all poses are on right. Correlation coefficients are indicated in the graphs

