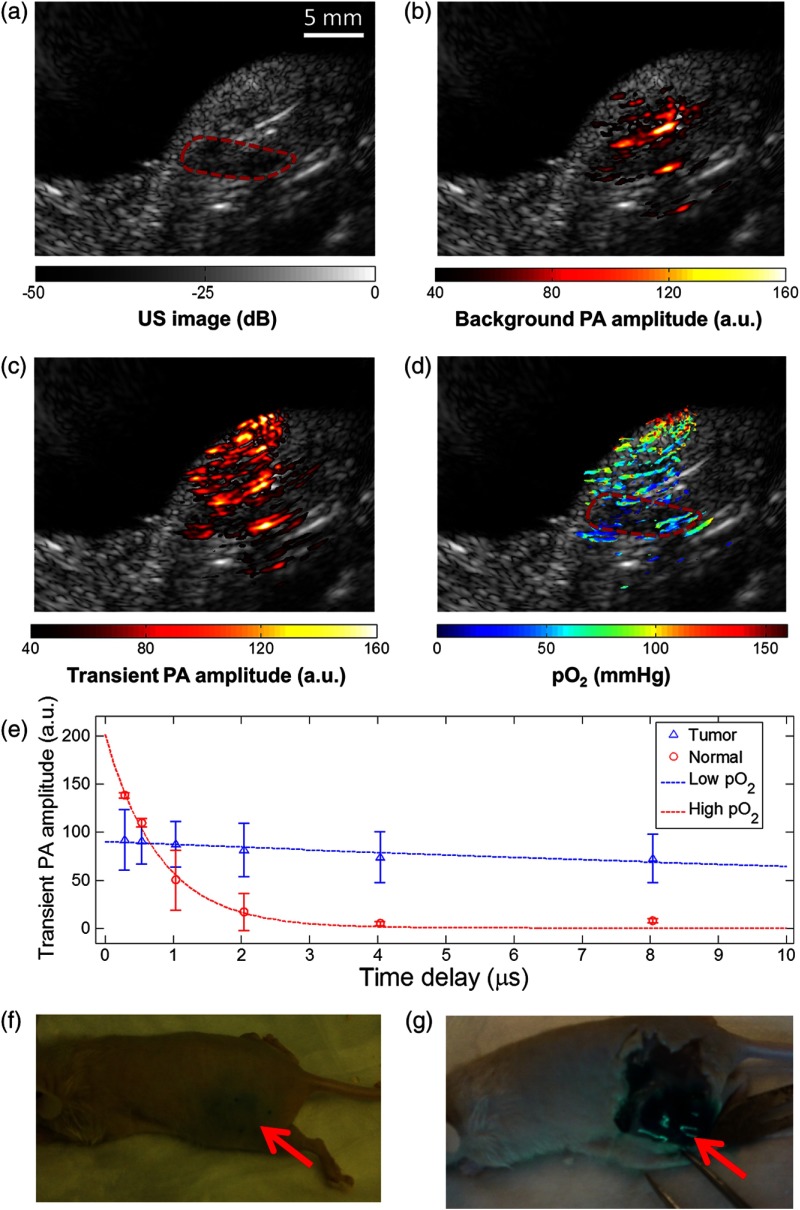
Fig. 4.
Multimodal imaging of the tumor-bearing mice. (a) US image of the left tumor-bearing hindlimb of a mouse. The area of the tumor is enclosed by a red dashed line. (b) PAI representing the amplitude of background absorption at 810 nm. Amplitude is displayed in linear scale. (c) PAI of the transient absorption of MB with an 810-nm laser at a pump–probe delay of 0.25 μs. (d) PALI of in color scale superimposed on US image. (e) Transient PA amplitudes of two representative pixels within the tumor and in normal control tissue, respectively. The triangles and circles are the averaged transient PA amplitudes of tumor and normal control tissue, respectively. The error bars represent the standard deviation of 100 recordings. Both the sets of data were fitted with an exponential curve as shown by the dashed line. (f) Animal after imaging procedure. An arrow indicates the MB stained imaging region. (g) Open-skin view of the tumor site. Note that the tissue was still stained with MB after the imaging process, thereby confirming stable MB staining of the tissue for a period of . The red arrow indicates the site of the tumor.

