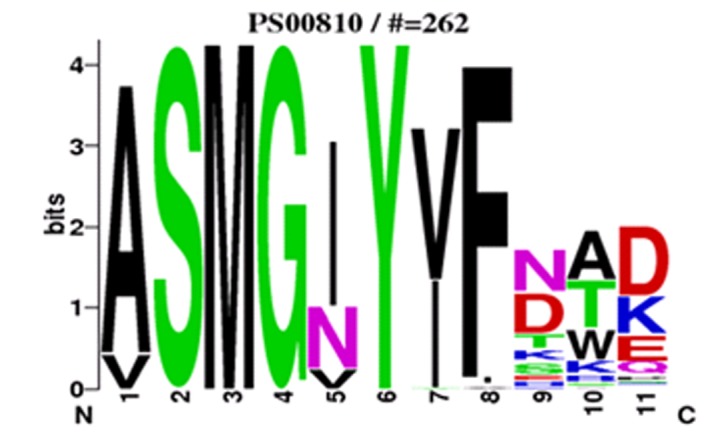
Figure 2.

WebLogo representation of motif of ADP Glucose pyrophosphorylase. The amino acid type and position are shown on the x axis. The overall height of the amino acid stacks, plotted on the y axis, indicates the sequence conservation at a given position, while the height of individual symbols within a stack indicates the relative frequency of an amino acid at that position. Amino acids are color coded according to their type as basic (blue), hydrophobic (black), polar/nonpolar (green), and acidic (red).
