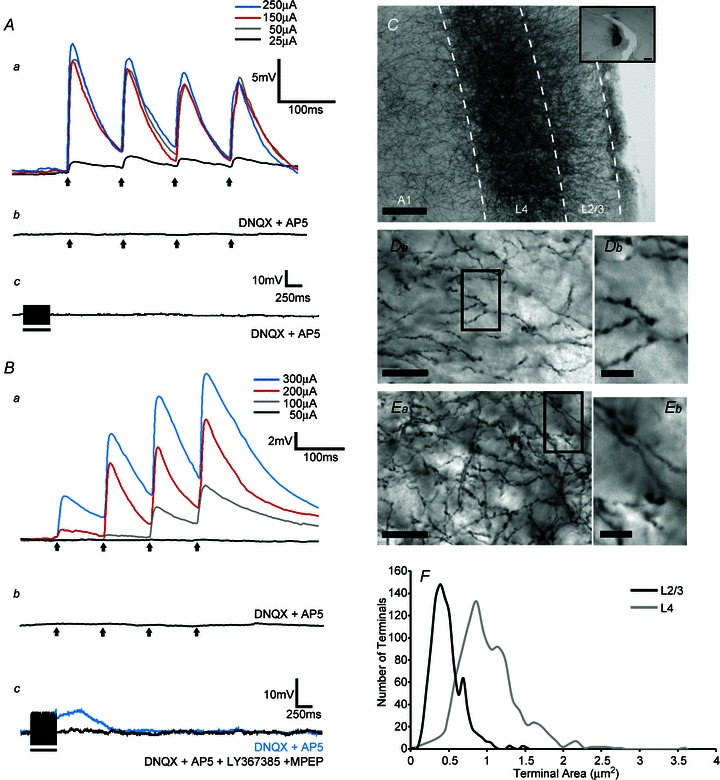
Figure 1. Examples of synaptic and anatomical characteristics of Class 1 and Class 2 inputs to layer 4 and layers 2/3 cells of the mouse primary auditory cortex (A1).

A, Class 1 response (average of 10 sweeps for each trace shown) in a layer 4 cell. Aa, this cell responded with paired-pulse depression to stimulation of ventral segment of the medial geniculate nucleus (MGNv) at 10 Hz. Responses were largely ‘all-or-none’, and EPSP amplitudes were largely unaffected by increases in stimulation intensities, reflecting the lack of convergence of MGNv inputs on layer 4 cells. Ab, stimulation at 10 Hz (250 μA), in the presence of the ionotropic glutamate antagonists DNQX and AP5 failed to produce any EPSPs. Ac, high frequency stimulation (125 Hz, 200 μA) in the presence of DNQX and AP5 did not produce any membrane potential changes, suggesting a lack of a metabotropic component. Arrows represent timing of stimulation for all 10 Hz trials and black bars represent the duration of stimulation in high frequency stimulation trials. B, Class 2 response in a layer 2/3 cell; also average of 10 sweeps for each trace. Ba, the cell responded with paired-pulse facilitation to MGNv stimulation at 10 Hz. Increasing stimulation intensities produced increases in EPSP amplitudes, possibly due to the high degree of convergence of these inputs onto a single cell. Bb, stimulation at 10 Hz (250 μA), in the presence of DNQX and AP5, failed to produce any EPSP. Bc, high frequency stimulation (125 Hz, 200 μA) in the presence of DNQX and AP5 produced a slow and prolonged membrane depolarization (blue trace) that could be blocked with a cocktail of type 1 (LY367385) and type 5 (2-methyl-6-(phenylethynyl)pyridine; MPEP) metabotropic glutamate receptor antagonists (black trace). C, anterograde labelling of axons and boutons in A1 following an injection of biotinylated dextran amine (BDA) in MGNv (inset). Da, BDA-labelled axons and boutons in layers 2/3 of A1. Highlighted area in Da can be seen at higher magnification in Db. Ea, BDA-labelled axons and boutons in layer 4 of A1. Highlighted area in Ea can be seen at higher magnification in Eb. F, histogram of bouton area in layers 2/3 and layer 4 of A1 (μm2). Scale bars: E, 125 mm; E inset, 0.25 mm; Da and Ea, 20 μm; Db and Eb, 5 μm). Reproduced from Viaene et al. (2011a).
