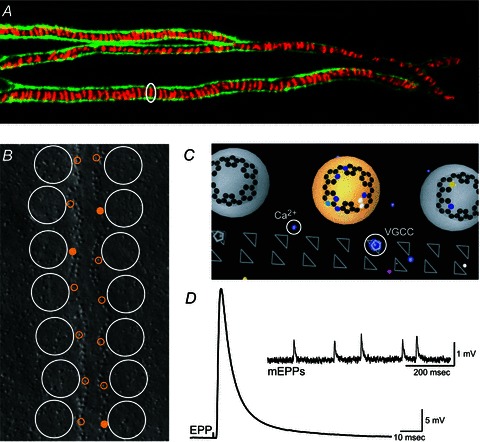
Figure 1. Structure and function of the frog neuromuscular junction.

A, portion of a large frog neuromuscular junction stained using FITC-labelled peanut lectin to decorate Schwann cell extracellular matrix (green) and Alexa594-labelled α-bungarotoxin to identify the location of postsynaptic receptor folds (red) immediately opposite presynaptic active zones. A single acetylcholine receptor band that represents the predicted position of one active zone is circled. Image obtained by S.D.M. following the protocols of Ko (1987) and Reddy et al. (2003). B, graphical depiction of the spatial organization of docked synaptic vesicles (large white circles) and presynaptic Ca2+ channels (small yellow circles; filled circles represent the fraction of channels that open on average during an AP stimulus) overlaid onto a freeze-fracture replica of about half of a frog neuromuscular junction active zone (Heuser et al. 1979). Graphic adapted from Luo et al. (2011). C, graphical representation of a small portion of the MCell computer model of the frog neuromuscular junction active zone (bottom view). In this graphic, synaptic vesicles are large grey or yellow spheres, synaptotagmin binding sites are represented as an array of black dots at the base of synaptic vesicles (binding sites with bound Ca2+ are coloured according to the Ca2+ channel contributing the ion), triangles represent the position of presynaptic active zone proteins (some of which are occupied by voltage-gated Ca2+ channels; VGCC), and coloured dots represent Ca2+ ions (Ca2+), colour coded based on the voltage-gated Ca2+ channel of origin. D, endplate potential (EPP) recorded from a single frog neuromuscular junction following exposure to 4 μmμ-conotoxin PIIIA to block selectively postsynaptic sodium channels (average of 10 sweeps). Inset, spontaneous miniature endplate potentials (mEPPs) recorded in the absence of nerve stimulation. Data in D obtained by S.D.M. from the cutaneous pectoris nerve-muscle preparation following the protocol of Shon et al. (1998).
