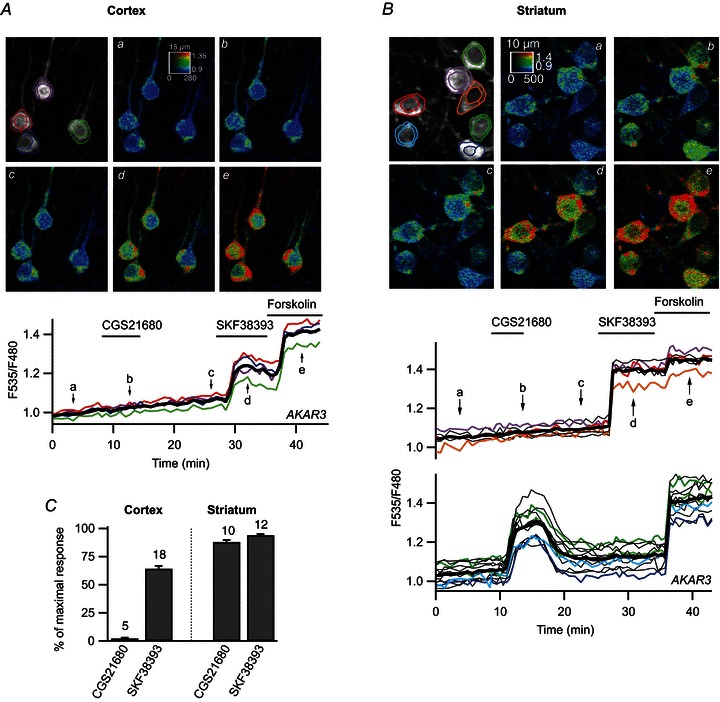
Figure 1. The PKA response to D1 stimulation was stronger in the striatum than in the cortex.

Prefrontal cortical neurones (A) and medium spiny neurones (B) in a mouse brain slice transduced for AKAR3 expression and imaged by two-photon laser-scanning microscopy. Images show the raw fluorescence at 535 nm (left, in grey scale) and the ratio (in pseudocolour), indicating levels of PKA-dependent phosphorylation at the times indicated by the corresponding arrows on the graph below. The calibration square on the pseudocolour image indicates from left to right increasing intensity levels, from bottom to top increasing ratio values. The size of the square is indicated above, in micrometres. Each trace on the graphs indicates the F535/F480 emission ratio measurements on the regions indicated by the colour contour on the grey-scale image; thin traces in black correspond to cells outside the displayed region; the thick black line represents the average of all the traces. The nucleus was excluded from the measurement. Each neurone responded to SKF38393 by an increase in F535/F480 ratio. Forskolin further increased the ratio to a maximal steady-state level. Note that the basal ratio differed between cells, and that these differences remained unchanged throughout the recording and during the response to forskolin; similar differences between cells were observed with the mutant probe (see Methods) and these differences do not reflect genuine differences in PKA activities. B, traces are separated into two plots on the basis of their response to the A2A agonist CGS21680 or the D1 agonist SKF38393. SKF38393 (1 μm), CGS21680 (1 μm) and forskolin (13 μm) were added to the bath during the time represented by the horizontal bar. C, amplitude of the AKAR3 response (normalised to the response to forskolin; see Methods) to CGS21680 and SKF38393. Striatal neurones are separated into two groups depending on their responsiveness to either CGS21680 or SKF38393; numbers above columns indicate the number of experiments.
