
Figure 2. D1 stimulation increases free cAMP concentration to higher levels in striatal neurones than in cortical neurones.
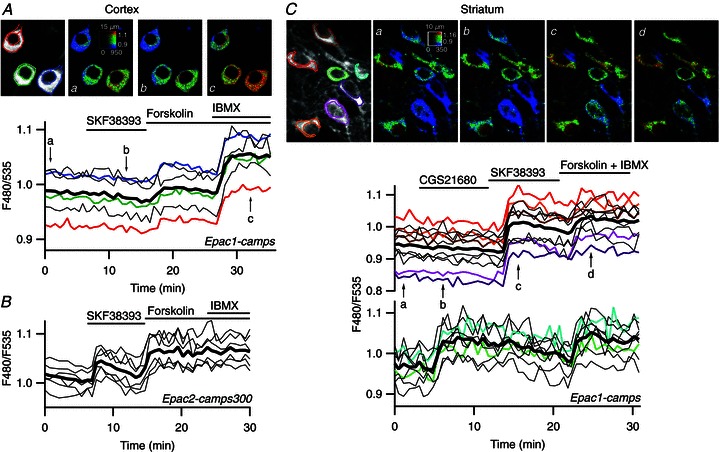
A, prefrontal cortical neurones in a mouse brain slice were transduced for expression of Epac1-camps and imaged by two-photon laser-scanning microscopy. Images show the raw fluorescence at 535 nm (left, in grey scale) and the ratio (in pseudocolour) indicating the change in conformation of Epac1-camps following binding to cAMP, at the times indicated by the arrows on the graph below. Each trace on the graphs indicates F480/F535 emission ratio measurements on regions indicated by the colour contour drawn on the raw images; thin traces in black correspond to cells outside the displayed region; the thick black line represents the average of all the traces. Forskolin increased the ratio to a moderate level and the non-specific inhibition of phosphodiesterases with IBMX resulted in a stronger response. B, as for A, except that the pyramidal cortical neurones were transduced with Epac2-camps300. SKF38393 triggered a clear response, which was further increased by forskolin. C, medium spiny neurones of the striatum transduced for Epac1-camps expression were imaged by two-photon laser-scanning microscopy. Traces are separated into two plots on the basis of the response to either the A2A agonist CGS21680 or to the D1 agonist SKF38393. SKF38393 (1 μm), CGS21680 (1 μm), forskolin (13 μm) and forskolin (13 μm) + IBMX (200 μm) were added to the bath during the time represented by the horizontal bar.