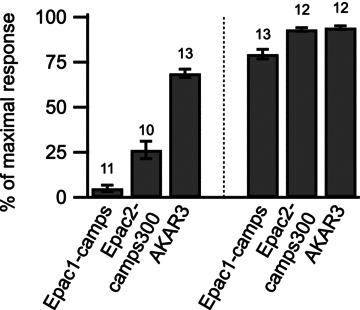
Figure 4. The cAMP/PKA response to D1 stimulation was stronger in the striatum than in the cortex, for all three biosensors, Epac1-camps, Epac2-camps300 and AKAR3.

The response amplitude measured with each biosensor was normalised with respect to the maximal biosensor response (see Methods) and plotted as a histogram. Error bars indicate the SEM; the number of brain slices used is indicated above each bar. The difference between cortex and striatum was significant for each of the three biosensors (P < 10−8 unpaired two-tailed t test).
