
Figure 7. VDF is weaker in dfcr compared to control IHCs after hearing onset in mice.
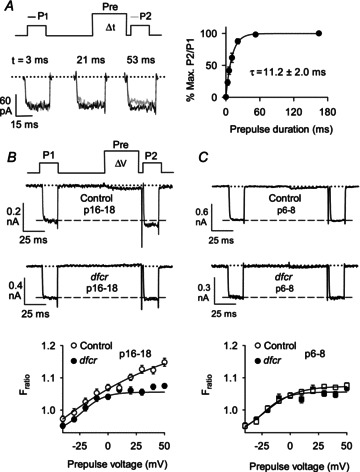
A, measurement of VDF onset. Left, voltage protocol and representative current traces obtained with indicated prepulse durations. P1 and P2 currents are overlaid for comparison. Right, P2/P1 ratios were expressed as percentage of the maximal VDF obtained with a 165 ms prepulse and plotted against prepulse duration. Smooth line represents single-exponential fit. The mean time constant (±SEM) is indicated. B and C, top, voltage protocol for IHC VDF showing 20 ms test pulses (P1, P2) from −75 to −15 mV separated by a 50 ms prepulse to various voltages. Representative traces for IBa obtained with +50 mV prepulse for IHCs from postnatal days (p) 16–18 (B) or p6–8 (C) control (n= 25 for p16–18, n= 18 for p6–8) or dfcr (n= 26 for p16–18, n= 18 for p6–8) mice. Dashed line represents initial amplitude of P1 current. Bottom, Fratio was calculated as P2 divided by P1 current amplitude and plotted against prepulse voltage.