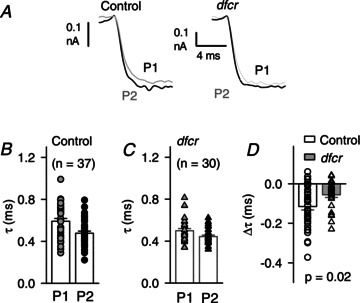
Figure 8. VDF accelerates IBa activation to a greater extent in control than in dfcr IHCs.

A, voltage protocol and representative traces for P1 and P2 currents overlaid for comparison of activation kinetics. Results are shown from IHCs from p16–18 control or dfcr mice. B and C, time constant (τ) from exponential fit of the rising phase of P1 and P2 IBa traces as shown in A from control (n= 37, B) and dfcr (n= 30, C) IHCs. Symbols represent values from individual cells, bars represent mean ± SEM. D, acceleration in activation due to VDF measured as the difference in τ for P1 and P2 (Δτ) measured as in B for control and dfcr IHCs. P value determined by t test.
