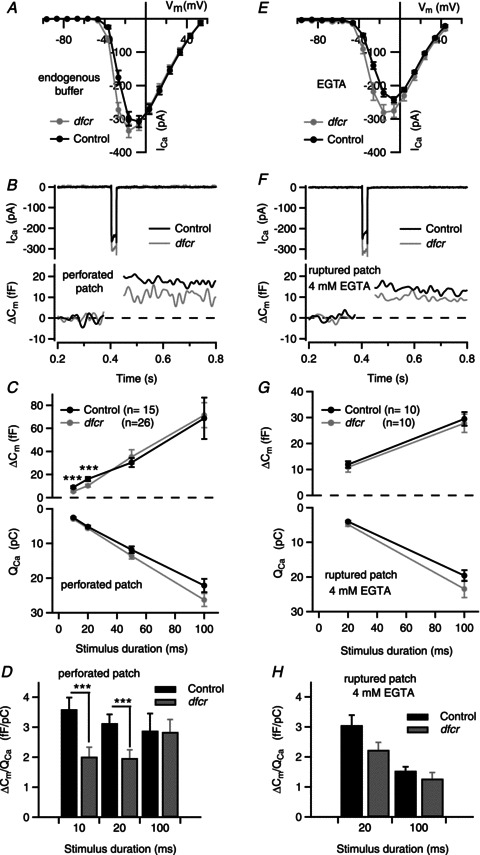
Figure 9. Presynaptic function is altered in dfcr IHCs.

ICa and exocytic membrane capacitance changes (ΔCm) were measured in perforated-patch (A–D) and ruptured-patch configurations (4 mm EGTA + 2 mm Ca2+ in the pipette, E–H). The extracellular Ca2+ was 10 mm to adequately resolve ΔCm. A, I–V relationship for ICa evoked by 10 ms voltage steps from −96.6 mV in perforated-patch recordings (control: n= 23, dfcr: n= 40). B, representative ICa and ΔCm (Cm filtered at 50 Hz) in response to 20 ms depolarization to voltage eliciting peak ICa. C, ΔCm (top) and corresponding ICa integral (QCa, bottom) in response to step pulses for the indicated durations. Depolarizations were from −96.6 mV to the voltage eliciting peak ICa (between −26.6 and −16.6 mV) for each cell. Data represent grand averages (calculated from the means of the individual cells, n= 26 for dfcr and 15 for control IHCs (p13–19) ± SEM. D, reduced Ca2+ efficiency of synchronous exocytosis in dfcr IHCs in response to depolarizations eliciting peak ICa in perforated- patch recordings. ΔCm was normalized to QCa obtained with different stimulus durations in B and C and shown for control and dfcr IHCs (***P < 0.01, by Student's t test). E, I–V relationship for ICa evoked by 10 ms voltage steps from −96.2 mV (control: n= 11, dfcr: n= 13) in ruptured-patch recordings. F and G, same as in B and C, but for data obtained with ruptured-patch configuration with 4 mm EGTA and 2 mm Ca2+ in the intracellular solution. In F, n= 10 for dfcr and 10 for control IHCs. G and H, tendency towards reduced Ca2+ efficiency of synchronous exocytosis was also observed in EGTA-loaded dfcr IHCs. H, same as in D, but for ruptured-patch configuration (n= 10 for control, n= 10 for dfcr).
