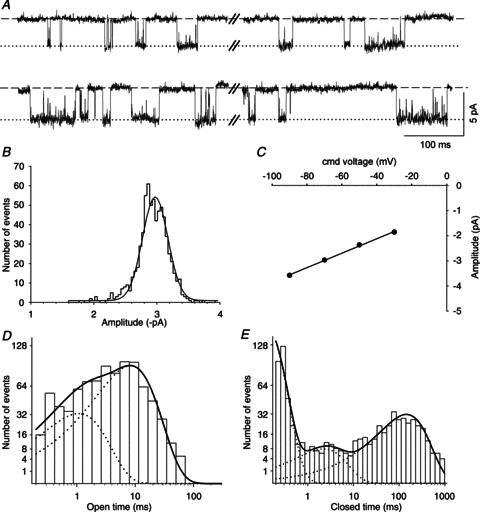
Figure 1. Conductance and kinetic properties of α3β4 nAChRs.

A, exemplar segments of a continouous cell-attached recording of single-channel activity from an SCG neuron cultured from an α5β2α7 triple-KO mouse. Channel openings were induced at a patch pipette potential of 70 mV by the addition of 3 μm ACh to the pipette solution. In this and subsequent figures, the dashed lines indicate the closed (zero-conductance) state, and the dotted lines indicate the open state of the channel. B, amplitude histogram generated as described in the Methods section and Gaussian fit (continuous line) from a 2 min recording at a patch pipette potential of 70 mV (mean amplitude ± SEM: −2.97 ± 0.01 pA). C, I–V plot: command (cmd) voltage plotted against the amplitude obtained from amplitude histograms generated at patch pipette potentials of 90, 70, 50 and 30 mV. The error bars (SEM) are smaller than the symbols and are therefore not visible. The calculated slope conductance is 28.8 ± 0.8 pS. D, channel open time distribution fitted by the sum of two exponential components (continuous line) with time constants τ1 = 1.07 ms (23% of all events) and τ2 = 8.32 ms (77% of all events). These data could also be fitted by the sum of three exponential components with time constants τ1 = 0.45 ms (10% of all events), τ2 = 4.89 ms (57% of all events) and τ3 = 11.9 ms (33% of all events). E, channel closed time distribution fitted with the sum of three exponential components with time constants τ1 = 0.11 ms, τ2 = 2.21 ms and τ3 = 144.4 ms (with relative frequencies of 40, 11 and 49%, respectively). The data in B–E were derived from the patch shown in A.
