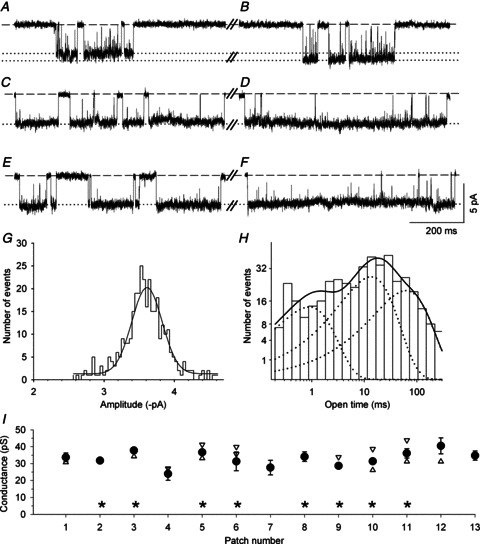
Figure 3. Conductance and kinetic properties of nAChRs in the β2 KO mouse model.

A and B, exemplar segments of a continouous cell-attached recording of single-channel activity from a β2 KO SCG neuron. These recordings are similar to the traces shown in Fig. 1A and Fig. 2A for the α5β2/α5β2α7 KO neurons, both with respect to their frequent closings and amplitudes. C–F, exemplar segments recorded from the same patch in A and B, showing channel activity with extra-long openings that are not interupted by closures and presumably result from the added presence of the α5 subunit (see H and Fig. 4B, C). G, amplitude histogram and Gaussian fit from a 2 min recording at a patch pipette potential of 70 mV (mean amplitude ± SEM: −3.61 ± 0.01 pA). H, channel open time distribution fitted with the sum of three exponential components (continuous line) with time constants τ1 = 0.89 ms (18% of all events), τ2 = 13.5 ms (46% of all events) and τ3 = 61.9 ms (36% of all events). The data from G and H were derived from the patch shown in A–F. I, summary of the channel conductance levels recorded from 13 different patches. The filled circles represent the main conductance level (±SEM), and the triangles show the lower (up triangles) and higher (down triangles) secondary conductance levels. The asterisks indicate the eight patches in which the channel open time distributions required fitting by three exponential components with pooled time constants of 0.30 ± 0.09 ms (10 ± 2% of all events), 9.16 ± 0.85 ms (61 ± 5% of all events) and 56.7 ± 7.2 ms (29 ± 4% of all events).
