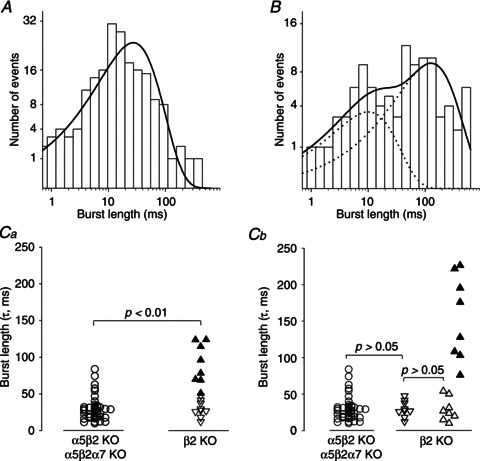
Figure 4. Burst length analysis in α5β2 double-KO (and α5β2α7 triple-KO) patches versusβ2 single-KO patches.

A, channel burst length distribution of α3β4 nAChRs recorded from the same patch shown in Fig. 1. The burst length distribution was fitted with one exponential component with a time constant of 27.3 ms. B, channel burst length distribution of nAChRs recorded from a β2 single-KO neuron (the same patch shown in Fig. 3A–H). The burst length distribution was fitted with two exponential components with time constants of 10.1 and 127.8 ms. Ca, summary of the burst durations of α3β4α5 receptors (recorded from β2 single-KO neurons) and α3β4 receptors (recorded from pooled α5β2/α5β2α7 double/triple-KO neurons). The p.d.f. of each burst length distribution was fitted to a single exponential in both the α5β2/α5β2α7 (circles) and the β2 KO neurons (triangles). The burst durations in the α5β2/α5β2α7 KO neurons were not distributed normally (P < 0.001, Kolmogorov–Smirnov test) and had a median τ of 27.3 ms (25th percentile: 18.0; 75th percentile: 32.4; n= 43 patches). The filled triangles show the burst length distributions from β2 single-KO patches that had extra-long channel openings and required fitting of their open time p.d.f. with a triple-exponential function (see Table 1 and Fig. 3H for an example). In contrast, the open triangles show the burst length distributions from β2 single-KO patches that had channel openings that were fitted to a double-exponential function. The burst durations differed significantly (P < 0.01, Mann–Whitney test) between the α5β2/α5β2α7 KO (median: 27.3 ms; n= 43) and β2 single-KO neurons (median: 47.6 ms; 27.2 and 87.3 for the 25th and 75th percentiles, respectively; n= 17). Cb, burst length distributions from the β2 KO neurons were resolved into three elements. The down triangles show the burst durations that were fitted with one exponential (median: 27.5 ms; 22.0 and 39.6 for the 25th and 75th percentiles, respectively; n= 9) and open times that were fitted with two exponential components. The up triangles show the burst durations that were fitted with two exponentials (open triangles: τ1 median: 25.4 ms; 16.1 and 45.5 for the 25th and 75th percentiles, respectively; n= 8; filled triangles: τ2 median 151.9 ms; 104.5 and 215.3 for the 25th and 75th percentiles, respectively; n= 8) and open times that were fitted with three exponential components. Statistical comparisons were made using the Mann–Whitney test.
