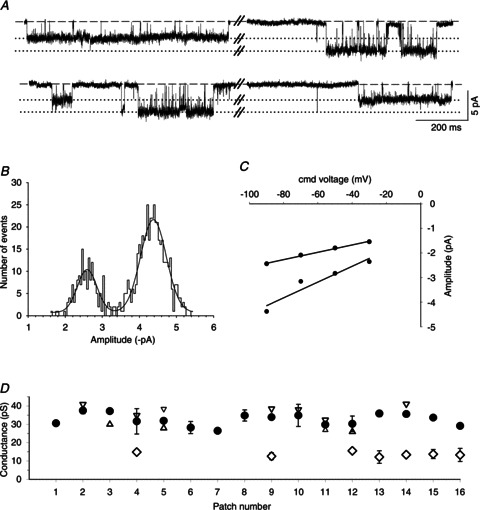
Figure 5. Conductance and kinetic properties of channels recorded in α5 KO neurons.

A, exemplar segments of a continouous cell-attached recording of single-channel activity from an α5 KO SCG neuron at a patch pipette potential of 90 mV. Note the prominent channel openings with amplitudes that differed by approximately 50%. B, amplitude histogram and Gaussian fit from a 2 min recording at a patch pipette potential of 90 mV showing two discrete peaks at –2.44 ± 0.01 and −4.37 ± 0.02 pA. C, I–V plot generated from the amplitude histograms at patch electrode potentials of 30, 50, 70 and 90 mV. The calculated slope conductances were 14.8 ± 0.8 and 31.6 ± 6.9 pS. D, summary of channel conductance levels from 16 patches. The circles represent the main conductance levels (±SEM), and the triangles show the lower (up triangles) and higher (down triangles) secondary conductance levels. The diamonds show a significantly smaller conductance level (±SEM) that was observed only in α5 KO patches. Note that these channels always occur together with – but did not transition directly between – receptors that are normally found in α5β2 double-KO neurons. For a summary of the kinetic parameters, see Table 1.
