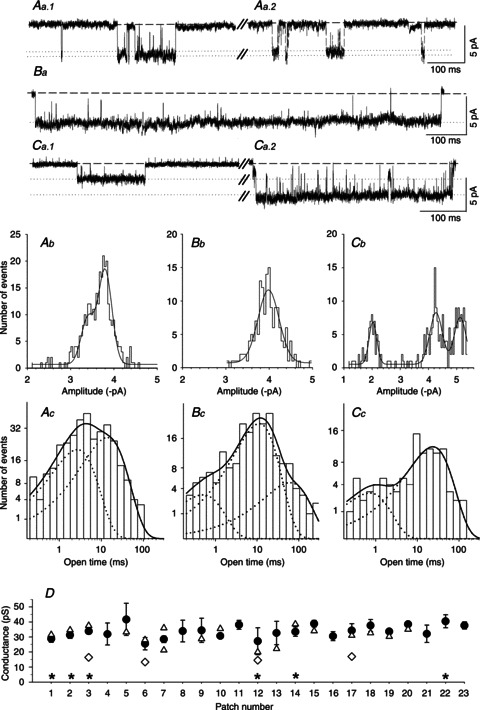
Figure 6. Conductance and kinetic properties of nACh receptors in wild type SCG neurons.

Aa–Ca, exemplar segments of continouous cell-attached recordings of single-channel activity from SCG neurons cultured from three different WT mice. Channel openings were recorded at a patch pipette potential of either 70 mV (Aa1, Aa2 and Ba) or 90 mV (Ca1 and Ca2). Aa1, the amplitude (slope conductance: 33 pS, data not shown) and relatively brief openings indicate the presence of an α3β4 receptor. Aa2, channel activity in the same patch as Aa1 showing a slightly smaller conductance level (see Ab). Ba, the amplitude (slope conductance: 31 pS, data not shown) and relatively long openings that are not interrupted by channel ‘flickering’ suggest the presence of an α3β4α5 receptor. Ca1, the amplitude (−2.01 ± 0.02 pA, see Cb) and somewhat longer openings (see Cc) suggest the presence of an α3β4β2 receptor. Ca2, the amplitude (−5.11 ± 0.02 pA, see Cb) and relatively brief openings indicate the presence of an α3β4 receptor in the same patch. Ab–Cb, amplitude histograms and Gaussian fits from 2 min segments of the recodings shown in traces Aa–Ca. Ab, main peak: −3.80 ± 0.01 pA; secondary peak: −3.40 ± 0.03 pA. Bb, single peak at −3.98 ± 0.01 pA. Cb, channel openings at three different amplitudes (−2.01 ± 0.02, −4.26 ± 0.02 and −5.11 ± 0.02 pA) were revealed in this patch. Ac–Cc, channel open time distributions from 2 min segments of the recordings shown in Aa–Ca. Ac, the data were fitted with the sum of two exponential components (continuous line) with τ1 = 1.71 ms (38% of all events) and τ2 = 15.0 ms (62% of all events). Bc, the data were fitted best with the sum of three exponential components (continuous line): τ1 = 0.50 ms (7% of all events), τ2 = 11.2 ms (74% of all events) and τ3 = 61.3 ms (19% of all events). Cc, kinetic analysis of the low-conductance state; data were fitted best with the sum of two exponential components (continuous line): τ1 = 0.72 (15% of all events) and τ2 = 23.3 ms (85% of all events). D, summary of the channel conductances measured from 23 patches. The circles represent the main slope conductances (±SEM), and the triangles show the secondary conductance levels. The diamonds show nAChRs in patches that – based on their conductance and longer open times – have the characteristics of α3β4β2 channels (15.4 ± 0.8 pS; τ1 = 0.67 ± 0.05 ms, τ2: 19.0 ± 1.7 ms; means ± SEM, n= 4). The asterisks indicate the six patches that contained putative α3β4α5 receptors (mean conductance ± SEM: 32.5 ± 1.9 pS) for which the channel open-time distributions required fitting with three exponential components with time constants τ1 = 0.38 ± 0.07 ms (7 ± 2% of all events), τ2 = 7.63 ± 1.32 ms (59 ± 10% of all events) and τ3 = 46.3 ± 7.2 ms (34 ± 10% of all events).
