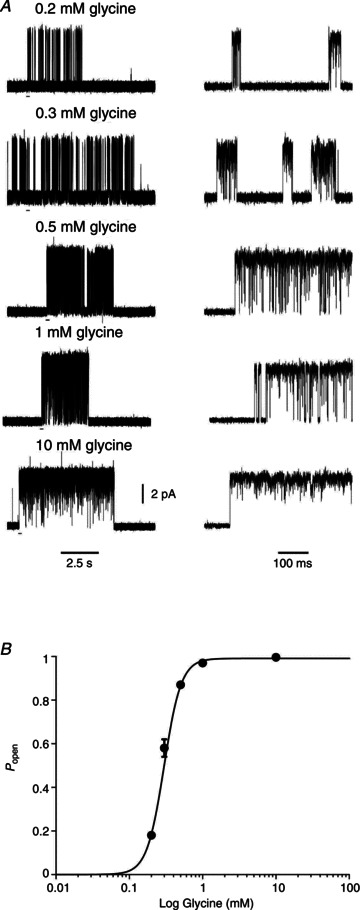
Figure 2. Concentration dependence of the open probability of homomeric α3 glycine receptor clusters.

A, examples of clusters recorded at 200, 300, 500, 1000 and 10,000 μm glycine. The bars under the traces on the left show the regions expanded in time on the right. B, cluster open probability, Popen, plot versus glycine concentration. The symbols show the mean values (with error bars for the SD of the mean, where this is bigger than the symbol size) for the patches included in the analysis (2–4 at each concentration). Popen values were obtained for each patch from the ratio between the total open time and the total clusters duration, from recordings idealized by time course fitting. The continuous line is a fit of the Hill equation, which yielded an EC50 of 297 ± 4 μm and a Hill slope of 3.7 ± 0.1.
