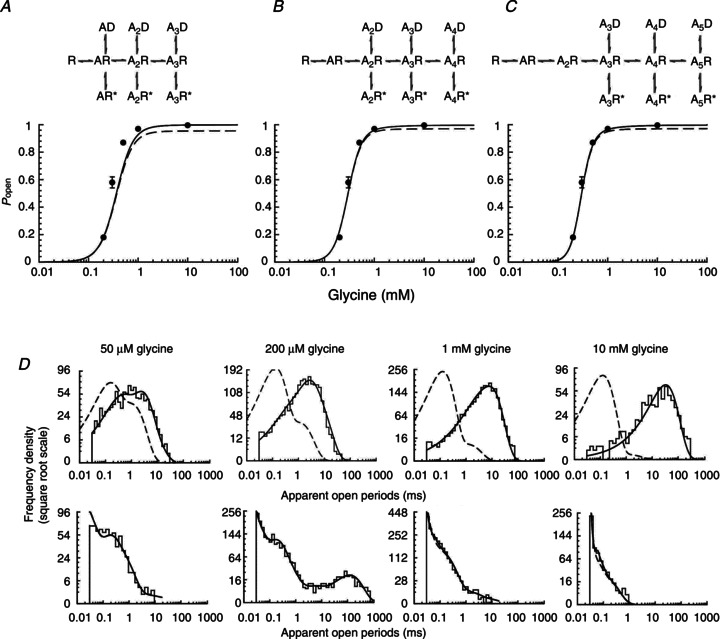
Figure 4. Fits of the Jones and Westbrook-type mechanisms to α3 GlyR single channel currents.

A–C, open probability curves predicted by rate constant estimates obtained by fits with Jones and Westbrook-type mechanisms (shown at top of the panels) with three, four or five agonist binding sites. Experimental Popen values are plotted as filled circles against the glycine concentration. The continuous line is the apparent Popen concentration curve predicted by the fitted scheme and rate constants, taking into account the effect of missed events. The dashed line is the ideal curve expected if no events are missed. D, probability density functions (continuous lines) predicted by the fit of Scheme 2 (five binding sites) for apparent open periods (top plots) and apparent shut times (bottom plots) are superimposed on the experimental histograms at four different glycine concentrations. The dashed lines are the distributions expected if there were no missed events.
